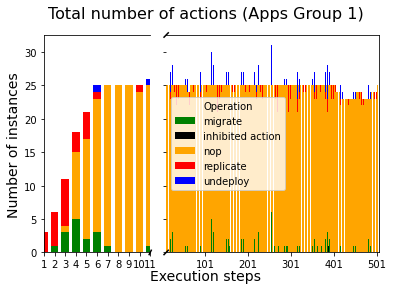
In some figures is important to “zoom” or highlight a region. You can reach the effect breaking the axe.
#dfa = dfa.rename(columns={"none":"inhibited action"})
#dfa = dfa.rename_axis('Operation',axis="columns")
#color = ["green","black","orange","red","blue"]

f,(ax,ax2) = plt.subplots(1,2,sharey=True, facecolor='w',gridspec_kw={'width_ratios': [1,2]})

f.subplots_adjust(wspace=0.1)
f.suptitle('Total number of actions (Apps Group 1)', size=16)

f.text(0.5, 0.03, 'Execution steps', ha='center',fontsize=14)
f.text(0.04, 0.5, 'Number of instances', va='center', rotation='vertical',fontsize=14)

dfa.plot.bar(stacked=True,ax=ax,width=0.7,color=color)
dfa.plot.bar(stacked=True,ax=ax2,width=0.9,color=color)

ax.set_xlim(0,10)
ax2.set_xlim(10,len(dfa))
ax.spines['right'].set_visible(False)
ax2.spines['left'].set_visible(False)

d = .010 # make the diagonal lines
kwargs = dict(transform=ax.transAxes, color='k', clip_on=False)
ax.plot((1-d,1+d), (-d,+d), **kwargs)
ax.get_legend().remove()
for tick in ax.get_xticklabels():
      tick.set_rotation(0)

kwargs.update(transform=ax2.transAxes)
ax2.plot((-d,+d), (1-d,1+d), **kwargs)
ax2.plot((-d,+d), (-d,+d), **kwargs)
ax2.xaxis.set_major_locator(plt.MaxNLocator(5))
for tick in ax2.get_xticklabels():
      tick.set_rotation(0)

plt.show()
f.savefig("actions.pdf", dpi=400)